Personal Linux R Server (Part III: Leveling Up)
After completing Part II: Software Setup, I had a fully functional personal Linux R server up and running, with a 2.8 GHz Intel Celeron G1840 CPU. I was ready to upgrade the CPU, as planned from the beginning. But first, redecorating...
(See also Part IV: Final Upgrades for selection and installation of the graphics card.)
Bling
The Corsair 250D case has a transparent window in the top panel, about 9" x 5.5" (22 x 14 cm). It is clearly intended for peering through to admire the wonderfulness within, but all I had going was one tiny LED on the motherboard, to indicate power on. It looked so ... plain.
I was basing my server on gaming and enthusiast components. If nothing else, Respect for the Traditions of the Culture demanded that I make at least a token effort towards case modding.
I consulted the catalogs. Illuminated case fans looked good. The Corsair 250D case comes with one 120mm fan on the side, but it has a room for an additional side fan of that size. I could swap out the existing one (next to the window) and then have the option of installing the original 120mm fan in the other space later. Might as well get another Corsair fan. Hoping for a dignified color, I ordered one with purple LEDs.
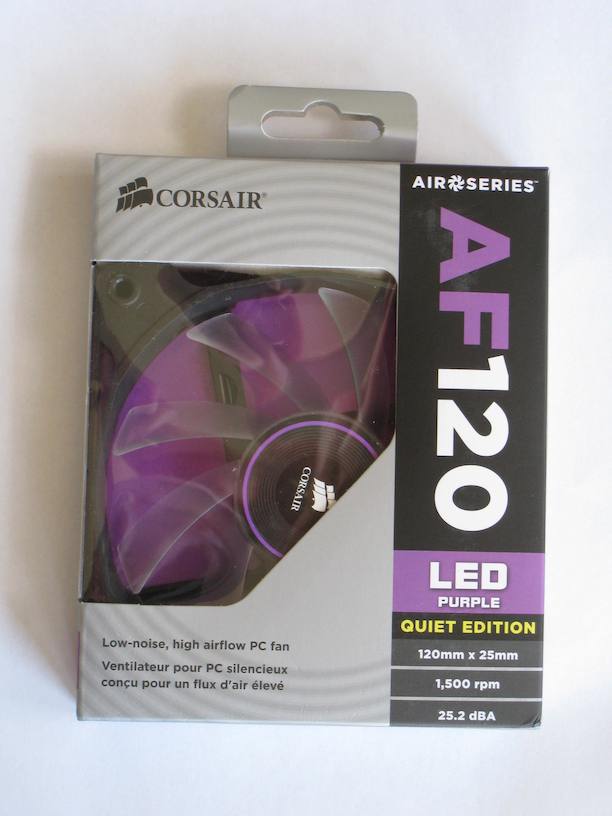
As a rationalist manqué, I was hoping I could use the cover story, "The aftermarket fan is a Quiet Edition. As such, it is much quieter than the stock fan, thus allowing me to concentrate far better on Hard and Serious Problems." No such luck. Here are the specs for the aftermarket fan:
AF120 Quiet Edition LED
Operating Voltage: 7V – 12V
Performance at 12V:
| Airflow | 52.19 CFM |
|---|---|
| Static Pressure | .75 mm/H20 |
| Sound Level | 25.2 dBA |
| Speed | 1,500 RPM |
| Power Usage | 0.40 A |
It was a little work to find information about the stock case fan, which listed simply as "AF120L" on the 250D parts list, but helpful "CorsairGeorge" reported on a forum:
Also, here's the specs for the AF120L and AF140L
AF120L
Current Draw: .11A Max
RPM: 1300
CFM: 57.13
Static Pressure: .916 mmH2O
AF140L
Current Draw: .12A Max
RPM: 1000
CFM: 67.43
Static Pressure: .764 mmH2O
The noise level testing is still being finalized but it's pretty competitive with aftermarket fans around the same RPM.
With very few exceptions, two fans at the same RPM will perform at similar noise levels. There are very few ways to make this significantly better as it's been perfected for a long time. At lower RPMs motor and bearing noise is more apparent so that's focused on heavily.
and also:
The AF120L and AF140L use the same shroud and impeller design that the AF120 and AF140 retail do. They do differ in the following ways:
- Sleeve bearing
- Lower RPM (stock case buyers are very concerned about noise levels)
- No rubber corners
- No color swappable rings
- Impeller is grey instead of black
- Longer cables
I would have liked the effect of a glowing light filling the entire case, but after I installed it I found that the fan LEDs just illuminate the fan itself. (I think you need to use CCFLs for the full-case glowing effect.) The Celeron doesn't need much cooling, so the fan runs slowly and the LEDs are dim when the computer is idling. The fan glows nicely, however, when the CPU is stressed and heats up and causes the fan to spin faster. Maybe I'll use, "Its a convenient way to visually monitor fan speed" as my cover story.
Processor and Cooler Choices
Here are the upgrade items:
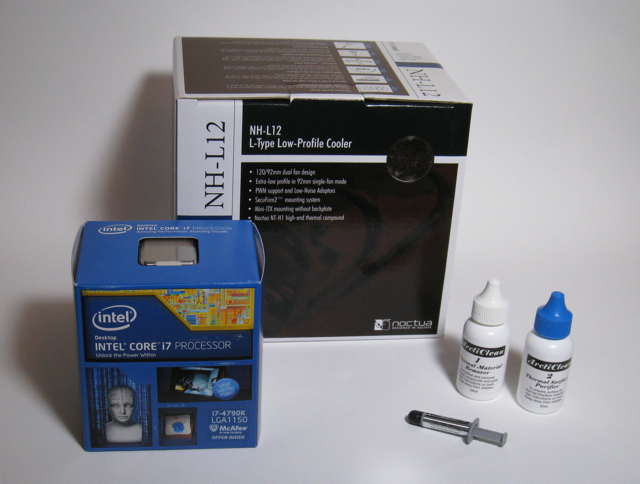
Noctua NH-L12 low-profile CPU cooler
ArctiClean thermal paste and cleaning kit
The i7-4790K CPU was the fastest available for this configuration at the time, so that was an easy choice. It has a 4.0 GHz stock speed. Although the "K" suffix means it can be overclocked, that was not my primary intention. The i7-4790 locked (non-overclockable) version has a slower speed of 3.6 GHz, however, so that was reason enough for me to choose the 4790K.
There were multiple choices for an improved cooler. The biggest coolers would not have fit in the Corsair 250D case, but the case was designed to be able to accept the high-end dual-fan:
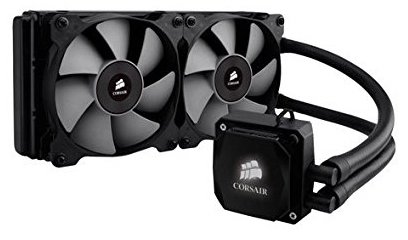
I considered it, for maximum geek-cred, but some users complained about its excessively loud fans. Also, it was not clear how much the inability to run the Windows-only software that accompanies it would be a problem.
The Noctua fans and coolers are known for being especially quiet. I was fairly confident that the dimensions of the NH-L12 would permit its installation in the case. It was not clear, however, if it would still fit if a CD/DVD drive was installed in the designated tray. I decided to install the cooler first, and make the decision about installing an optical drive later.
The Noctua NH-L12 came with its own little tube of thermal paste, so I did not immediately need the ArctiClean paste that came in the 3-piece kit. The two bottles of cleaning solutions proved useful, however, both for clean off the paste from the previous Celeron CPU and stock cooler, and for when I had to remove and reinstall the Noctua cooler from the new CPU.
Installation
Once again, a NewEgg TV video proved useful:
I was initially wary of the suggestion that a coffee filter be used to clean the surface of the CPU, but the recommendation is pretty universal, including in the detailed Arctic Silver manual:
Even Good Houskeeping says they are lint-free and good for at least 11 different things besides filtering coffee.
I found it straightforward to follow the Noctua installation instructions. The process required access to the bottom of the motherboard, so I unhooked everything and removed the board from the case. As the instructions suggested might be the case, it was not possible to use the standard "X" bracket on the back of the motherboard due to the location of components on the Mini-ITX board. They supply alternate mounting posts to be used in securing the mounting brackets, and it all worked as instructed.
At this point I made a minor tactical error. While the board was conveniently out of the case, I attached the entire cooler to the board, and then attempted to reinstall the whole thing. This had worked just fine when I was using the stock cooler, but the Noctua cooler was much bigger. I realized the upper fan was blocking access to the mounting screws. I detached the upper fan. One of the mounting screws was still mostly covered by the cooler, so I dug up a right-angle screwdriver to try to tighten it a bit. Then I found it was almost impossible to reattach all the cables with the cooler covering the board. Mistake. I removed the whole motherboard and took off the cooler, leaving only the mounting brackets in place. I got to practice with coffee filter and cleaning solutions again.
The bright side was that I got to inspect the thermal paste after it had spread out over the CPU by being squished by the cooler's heatsink. I saw that I had used the correct amount (about the size of a small pea, in the center of the CPU); the paste had spread out to the edges of the CPU but no farther.
I reinstalled the board, reattached all the cables, re-dabbed the CPU with thermal paste, and carefully lowered the Noctua cooler (without the upper fan) and tightened it into place. (I had previously removed the side fan, for easier access, but left its cable attached to the motherboard.) All was well this time.
The system passed the smoke test and booted successfully. I rebooted and hit F2 during startup to get into the BIOS control screen, selected the Monitor page, and re-ran Qfan Tuning. With a new CPU fan, this seemed like an important step. The calibration indeed changed:
CPU Fan Min. Duty Cycle (%): 52 -> 15
Chassis Fan 1 Min. Duty Cycle (%): 28 -> 31
Chassis Fan 2 Min. Duty Cycle (%): 31 -> 40
The CPU minimum duty cycle dropped substantially, which is what I would expect from a higher-quality fan. From this point on, no more CPU Fan Errors were observed.
Benchmarks and Testing
i7-4790K Temperatures
The Intel Temperature Guide on tomshardware.com gives the following parameters for the 4790K:
4th Generation 22 Nanometer: 4790K (TDP 88W / Idle 2W)
Standard Ambient = 22C
Tcase (CPU temp) = 74C
CPU / Core offset + 5C
Tjunction (Core temp) = 79C
Tj Max (Throttle temp) = 100C
The Core temperatures above show that mid 70's are safe.
Prime95 / mprime
The mprime tool did not run at first. The problem was some leftover configuration files it had written when a completely different (2 core Celeron) CPU was installed.
Deleting these files caused it to be unconfused:
cd ~/mprime
rm local.txt
rm prime.txt
Immediately after the upgrade, I had not yet learned that mprime versions after 26.6 were not recommended for stress-testing these CPUs, so my initial test was with version 28.5.
Starting the mprime 28.5 Torture Test #1 (Small FFT) caused the highest core temperature to rise to 82°C after 2 minutes. After 5 minutes the highest core temperature was 86°C and I terminated the test. Two minutes after the end of the test, all core temperatures were below 35°C.
One of the cores reported temperatures noticeably lower than the others. Here is a typical sensors output during the previous 5-minute test:
coretemp-isa-0000
Adapter: ISA adapter
Physical id 0: +84.0°C  (high = +80.0°C, crit = +100.0°C)
Core 0:        +84.0°C  (high = +80.0°C, crit = +100.0°C)
Core 1:        +83.0°C  (high = +80.0°C, crit = +100.0°C)
Core 2:        +84.0°C  (high = +80.0°C, crit = +100.0°C)
Core 3:        +77.0°C  (high = +80.0°C, crit = +100.0°C)
Several days later, I repeated the #1 Small FFT test with mprime 26.6. At bootup, the core temperatures were all 30°C or below. After 5 minutes, the peak temperature on any core was a more moderate 75°C. This suggested to me that the new cooling system was doing its job acceptably with the new CPU.
Right after that, I tried a quick check of the unrecommended mprime 28.5 (Small FFT test) again for comparison. After 60 seconds, the peak core temperature was 85°C: essentially the same response as on the first day.
R Benchmark
Results for the upgraded system:
   R Benchmark 2.5
   ===============
Number of times each test is run__________________________:  3

   I. Matrix calculation
   ---------------------
Creation, transp., deformation of a 2500x2500 matrix (sec):  0.63833333333334
2400x2400 normal distributed random matrix ^1000____ (sec):  0.444666666666658
Sorting of 7,000,000 random values__________________ (sec):  0.518666666666652
2800x2800 cross-product matrix (b = a' * a)_________ (sec):  7.75766666666667
Linear regr. over a 3000x3000 matrix (c = a \ b')___ (sec):  3.79366666666667
                      --------------------------------------------
                 Trimmed geom. mean (2 extremes eliminated):  1.07894260658742

   II. Matrix functions
   --------------------
FFT over 2,400,000 random values____________________ (sec):  0.265666666666675
Eigenvalues of a 640x640 random matrix______________ (sec):  0.584333333333338
Determinant of a 2500x2500 random matrix____________ (sec):  2.64200000000002
Cholesky decomposition of a 3000x3000 matrix________ (sec):  3.13666666666667
Inverse of a 1600x1600 random matrix________________ (sec):  2.19800000000001
                      --------------------------------------------
                Trimmed geom. mean (2 extremes eliminated):  1.50270496352845

   III. Programmation
   ------------------
3,500,000 Fibonacci numbers calculation (vector calc)(sec):  0.437666666666682
Creation of a 3000x3000 Hilbert matrix (matrix calc) (sec):  0.161333333333346
Grand common divisors of 400,000 pairs (recursion)__ (sec):  0.66700000000003
Creation of a 500x500 Toeplitz matrix (loops)_______ (sec):  0.241666666666674
Escoufier's method on a 45x45 matrix (mixed)________ (sec):  0.310999999999979
                      --------------------------------------------
                Trimmed geom. mean (2 extremes eliminated):  0.320410596702259


Total time for all 15 tests_________________________ (sec):  23.7983333333334
Overall mean (sum of I, II and III trimmed means/3)_ (sec):  0.803883247606418
                      --- End of test ---
These total time and overall mean values are about 80-90% higher than the values for the 2010 Mac Pro. The relative speedup of individual tests vary from 27% to 226%. Maximum core temperature during the benchmark was about 60°C.
The motherboard BIOS setup has an option called "EZ System Tuning" which can do "factory custom" overclocking. I switched it from "Normal" to "ASUS Optimal" i.e. fastest. The R benchmark ran about 5% faster:
Total time for all 15 tests_________________________ (sec):  22.6583333333333
Overall mean (sum of I, II and III trimmed means/3)_ (sec):  0.768417622383206
Peak core temperature went from 60°C to 70°C with overclocking. It didn't seem like a good enough tradeoff, so I switched it back to "Normal."
Linpack
I tried linpack by running:
./runme_xeon64
Core temperatures oscillated between 60°C and an unhealthy 88°C over the 6 minutes I let it run. Results here:
Wed Mar 11 21:54:41 PDT 2015
Intel(R) Optimized LINPACK Benchmark data

Current date/time: Wed Mar 11 21:54:41 2015

CPU frequency:    4.396 GHz
Number of CPUs: 1
Number of cores: 4
Number of threads: 8

Parameters are set to:

Number of tests: 15
Number of equations to solve (problem size) : 1000  2000  5000  10000 15000 18000 20000 22000 25000 26000 27000 30000 35000 40000 45000
Leading dimension of array                  : 1000  2000  5008  10000 15000 18008 20016 22008 25000 26000 27000 30000 35000 40000 45000
Number of trials to run                     : 4     2     2     2     2     2     2     2     2     2     1     1     1     1     1
Data alignment value (in Kbytes)            : 4     4     4     4     4     4     4     4     4     4     4     1     1     1     1

Maximum memory requested that can be used=16200901024, at the size=45000

=================== Timing linear equation system solver ===================

Size   LDA    Align. Time(s)    GFlops   Residual     Residual(norm) Check
1000   1000   4      0.013      52.8952  6.294965e-13 2.146745e-02   pass
1000   1000   4      0.008      87.6100  6.294965e-13 2.146745e-02   pass
1000   1000   4      0.007      94.7303  6.294965e-13 2.146745e-02   pass
1000   1000   4      0.007      94.5843  6.294965e-13 2.146745e-02   pass
2000   2000   4      0.085      62.4816  2.861267e-12 2.488952e-02   pass
2000   2000   4      0.085      62.6455  2.861267e-12 2.488952e-02   pass
5000   5008   4      0.604      137.9428 1.648793e-11 2.299109e-02   pass
5000   5008   4      0.579      144.1230 1.648793e-11 2.299109e-02   pass
10000  10000  4      3.417      195.1857 6.318562e-11 2.227989e-02   pass
10000  10000  4      3.458      192.8683 6.318562e-11 2.227989e-02   pass
15000  15000  4      10.896     206.5316 1.436672e-10 2.262782e-02   pass
15000  15000  4      10.916     206.1640 1.436672e-10 2.262782e-02   pass
18000  18008  4      18.424     211.0646 2.209714e-10 2.419908e-02   pass
18000  18008  4      18.448     210.7844 2.209714e-10 2.419908e-02   pass
20000  20016  4      24.965     213.6650 2.873690e-10 2.543845e-02   pass
20000  20016  4      24.900     214.2264 2.873690e-10 2.543845e-02   pass
Wow, over 200 GFLOPS at the top run.
I ran linpack on the 2010 Mac Pro as well:
./runme64
Here are those results:
Intel(R) Optimized LINPACK Benchmark data

Current date/time: Thu Mar 12 08:29:10 2015

CPU frequency:    3.058 GHz
Number of CPUs: 1
Number of cores: 4
Number of threads: 8

Parameters are set to:

Number of tests: 9
Number of equations to solve (problem size) : 15000 14000 13000 12000 11000 10000 8000  6000  1000
Leading dimension of array                  : 15000 14008 13000 12008 11000 10008 8008  6008  1000
Number of trials to run                     : 1     2     2     2     2     2     2     3     4
Data alignment value (in Kbytes)            : 4     4     4     4     4     4     4     4     4

Maximum memory requested that can be used=1800304096, at the size=15000

=================== Timing linear equation system solver ===================

Size   LDA    Align. Time(s)    GFlops   Residual     Residual(norm) Check
15000  15000  4      63.857     35.2419  2.298756e-10 3.620579e-02   pass
14000  14008  4      52.667     34.7413  1.953428e-10 3.527683e-02   pass
14000  14008  4      51.453     35.5609  1.953428e-10 3.527683e-02   pass
13000  13000  4      42.386     34.5633  1.701041e-10 3.559301e-02   pass
13000  13000  4      42.477     34.4890  1.701041e-10 3.559301e-02   pass
12000  12008  4      32.230     35.7517  1.230560e-10 3.020391e-02   pass
12000  12008  4      33.609     34.2851  1.230560e-10 3.020391e-02   pass
11000  11000  4      25.862     34.3202  1.031222e-10 3.008505e-02   pass
11000  11000  4      25.430     34.9020  1.031222e-10 3.008505e-02   pass
10000  10008  4      21.929     30.4108  9.915883e-11 3.496441e-02   pass
10000  10008  4      19.512     34.1780  9.915883e-11 3.496441e-02   pass
The fastest run on the older Mac was about 35 GFLOPS. I used Hardware Monitor to watch the CPU temperatures on the Mac. It hit a peak of 86°C before I stopped the test.
So that's a factor of six speedup for the new system over the Mac Pro. Does it make sense?
I think so. An article from 2012 (Intel’s Haswell is an unprecedented threat to Nvidia, AMD) helped me to understand. The theoretical-maximum GFLOPS for the architectures used by the 2010 Mac Pro and the new 4790K are calculated as follows:
| Architecture | Calculation | Value |
|---|---|---|
| Nehalem | (3.058 GHz) x (4 cores) x (4 DP FLOPS / cycle) | 49 GFLOPS |
| Haswell | (4.396 GHz) x (4 cores) x (16 DP FLOPS / cycle) | 281 GFLOPS |
In both cases, the best Linpack results are roughly three-quarters of the theoretical maxima. The big boost that Haswell gets is due to the AVX2 & FMA instruction sets.
Linpack itself is a highly-optimized bit of code whose performance is not expected to be typical of most real-world problems. It's encouraging, however, to think about the potential power that's available if the right problem should happen to come along.
What's Next
A few additional components, including a graphics card, are to be discussed in Part IV: Final Upgrades.
I did try forcing the number cores to 4, which is done by using this:
export OMP_NUM_THREADS=4That didn't appear to make a significant difference for the maximum GFLOPS, although it did help some for tests at smaller sizes.